TYPES OF SLOPES
Mapping –
Level 3
You may need to determine not only the height of a hill, but the degree of the hill’s slope as well. The rate of rise or fall of a terrain feature is known as its slope. The speed at which people can move is affected by the slope of the ground or terrain feature. This slope can be determined from the map by studying the contour lines—the closer the contour lines, the steeper the slope; the farther apart the contour lines, the gentler the slope. Four types of slopes are as follows:
- Gentle. Contour lines showing a uniform, gentle slope will be evenly spaced and wide apart (Figure 1).
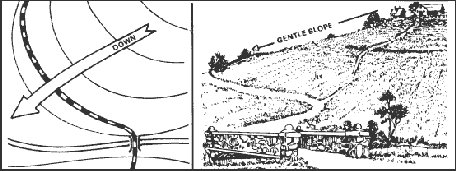
Figure 1. Uniform, gentle slope.
- Steep. Contour lines showing a uniform, steep slope on a map will be evenly spaced, but close together. Remember, the closer the contour lines, the steeper the slope (Figure 2).
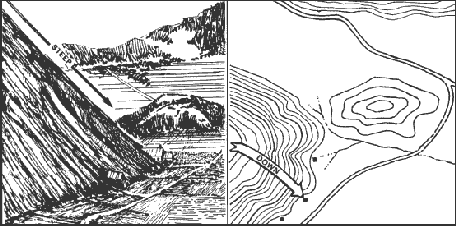
Figure 2. Uniform, steep slope.
- Concave. Contour lines showing a concave slope on a map will be closely spaced at the top of the terrain feature and widely spaced at the bottom (Figure 3).
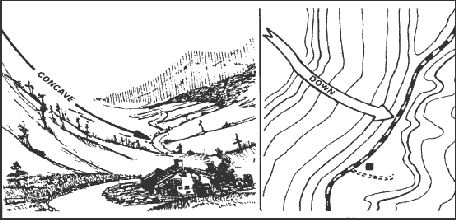
Figure 3. Concave slope.
- Convex. Contour lines showing a convex slope on a map will be widely spaced at the top and closely spaced at the bottom (Figure 4).
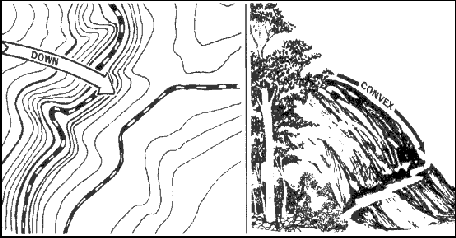
Figure 4. Convex slope.
PERCENTAGE OF SLOPE
The speed at which you can move up or down a hill is affected by the slope of the ground. Because of this, a more exact way of describing a slope is necessary.
- Slope may be expressed in several ways, but all depend upon the comparison of vertical distance (VD) to horizontal distance (HD) (Figure 5). Before we can determine the percentage of a slope, we must know the VD of the slope. The VD is determined by subtracting the lowest point of the slope from the highest point. Use the contour lines to determine the highest and lowest point of the slope (Figure 6).
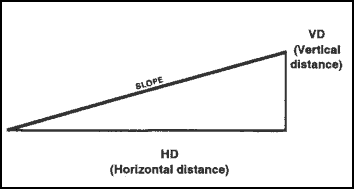
Figure 5. Slope diagram.
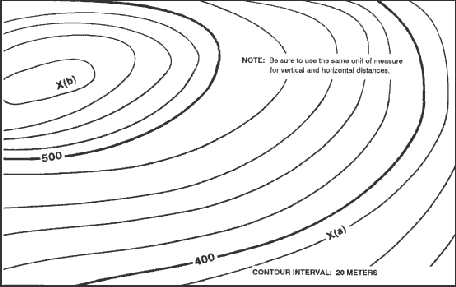
Figure 6. Contour line around a slope.
- To determine the percentage of the slope between points (a) and (b) in Figure 6, determine the elevation of point (b) (590 meters). Then determine the elevation of point
(a) (380 meters). Determine the vertical distance between the two points by subtracting the elevation of point (a) from the elevation of point .The difference (210 meters) is the VD between points (a) and (b). Then measure the HD between the two points on the map in Figure 7. After the horizontal distance has been determined, compute the percentage of the slope by using the formula shown in Figure 8.
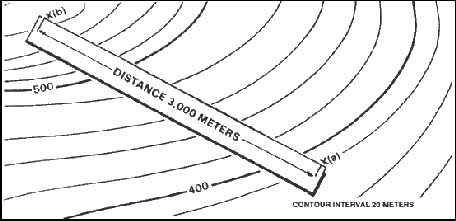
Figure 7. Measuring horizontal distance.
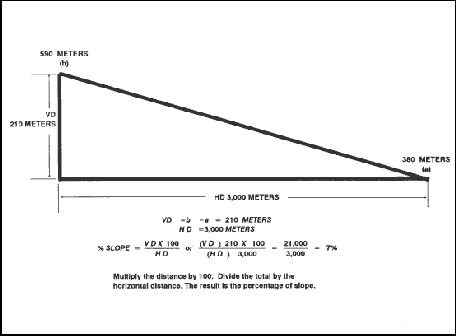
Figure 8.
Percentage of slope in meters.
- The slope angle can also be expressed in degrees. To do this, determine the VD and HD of the slope. Multiply the VD by 57.3 and then divide the total by the HD (Figure 9). This method determines the approximate degree of slope and is reasonably accurate for slope angles less than 20º.
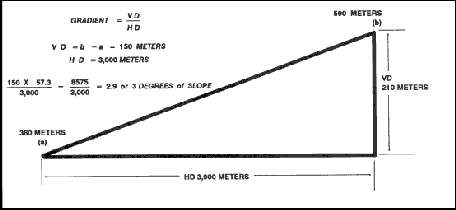
Figure 9. Degree of slope.
- The slope angle can also be expressed as a gradient. The relationship of horizontal and vertical distance is expressed as a fraction with a numerator of one (Figure 10).
TERRAIN FEATURES
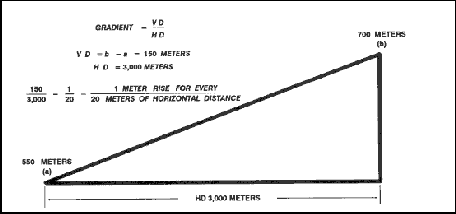
Figure 10. Gradient.
All terrain features are derived from a complex landmass known as a mountain or ridgeline (Figure 11). The term ridgeline is not interchangeable with the term ridge. A ridgeline is a line of high ground, usually with changes in elevation along its top and low ground on all sides from which a total of 10 natural or man-made terrain features are classified.
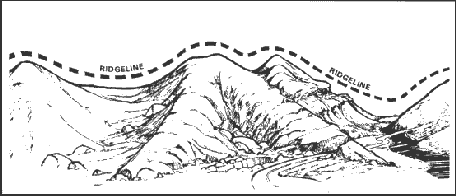
Figure 11. Ridgeline.
- Major Terrain Features.
- Hill. A hill is an area of high ground. From a hilltop, the ground slopes down in all directions. A hill is shown on a map by contour lines forming concentric circles. The inside of the smallest closed circle is the hilltop (Figure 12).
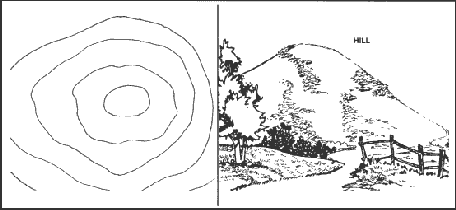
Figure 12. Hill.
- Saddle. A saddle is a dip or low point between two areas of higher ground. A saddle is not necessarily the lower ground between two hilltops; it may be simply a dip or break along a level ridge crest. If you are in a saddle, there is high ground in two opposite directions and lower ground in the other two directions. A saddle is normally represented as an hourglass (Figure 13).
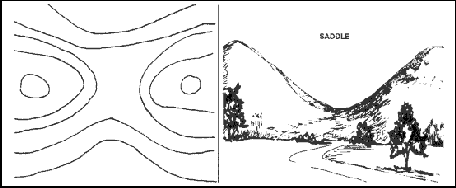
Figure 13. Saddle.
- Valley. A valley is a stretched-out groove in the land, usually formed by streams or rivers. A valley begins with high ground on three sides, and usually has a course of running water through it. If standing in a valley, three directions offer high ground, while the fourth direction offers low ground. Depending on its size and where a person is standing, it may not be obvious that there is high ground in the third direction, but water flows from higher to lower ground. Contour lines forming a valley are either U-shaped or V-shaped. To determine the direction water is flowing, look at the contour lines. The closed end of the contour line (U or V) always points upstream or toward high ground (Figure 14).
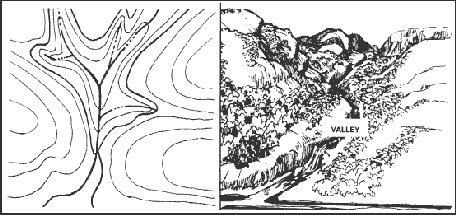
Figure 14. Valley.
- Ridge. A ridge is a sloping line of high ground. If you are standing on the centerline of a ridge, you will normally have low ground in three directions and high ground in one direction with varying degrees of slope. If you cross a ridge at right angles, you will climb steeply to the crest and then descend steeply to the base. When you move along the path of the ridge, depending on the geographic location, there may be either an almost unnoticeable slope or a very obvious incline. Contour lines forming a ridge tend to be U-shaped or V-shaped. The closed end of the contour line points away from high ground (Figure 15).
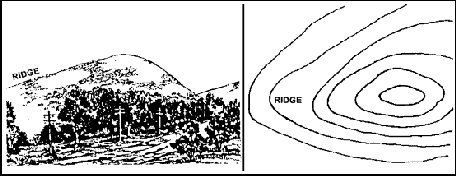
Figure 15. Ridge.
- Depression. A depression is a low point in the ground or a sinkhole. It could be described as an area of low ground surrounded by higher ground in all directions, or simply a hole in the ground. Usually only depressions that are equal to or greater than the contour interval will be shown. On maps, depressions are represented by closed contour lines that have tick marks pointing toward low ground (Figure 16).
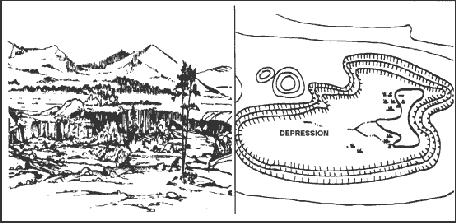
Figure 16. Depression.
- Minor Terrain Features.
- Draw. A draw is a less developed stream course than a valley. In a draw, there is essentially no level ground and, therefore, little or no maneuver room within its confines. If you are standing in a draw, the ground slopes upward in three directions and downward in the other direction. A draw could be considered as the initial formation of a valley. The contour lines depicting a draw are U- shaped or V-shaped, pointing toward high ground (Figure 17).
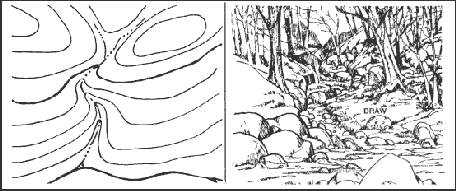
Figure 17. Draw.
- Spur. A spur is a short, continuous sloping line of higher ground, normally jutting out from the side of a ridge. A spur is often formed by two rough parallel streams, which cut draws down the side of a ridge. The ground sloped down in three directions and up in one direction. Contour lines on a map depict a spur with the U or V pointing away from high ground (Figure 18).
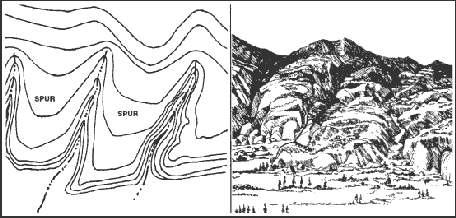
Figure 18. Spur.
- Cliff. A cliff is a vertical or near vertical feature; it is an abrupt change of the land. When a slope is so steep that the contour lines converge into one “carrying” contour of contours, this last contour line has tick marks pointing toward low ground (Figure 19A). Cliffs are also shown by contour lines very close together and, in some instances, touching each other (Figure 19B).
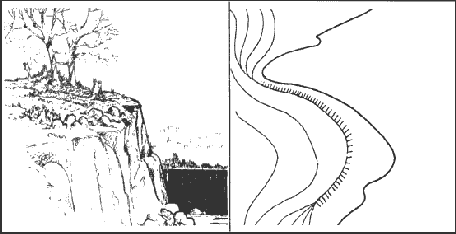
Figure 19A. Cliff.
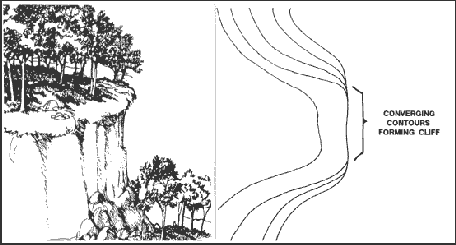
Figure 19B. Cliff.
- Supplementary Terrain Features.
- Cut. A cut is a man-made feature resulting from cutting through raised ground, usually to form a level bed for a road or railroad track. Cuts are shown on a map when they are at least 10 feet high, and they are drawn with a contour line along the cut line. This contour line extends the length of the cut and has tick marks that extend from the cut line to the roadbed, if the map scale permits this level of detail (Figure 20).
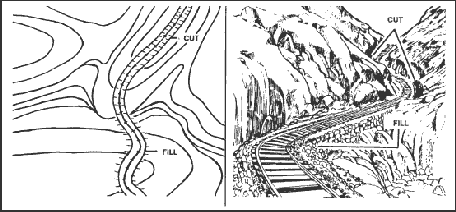
Figure 20. Cut and fill.
- Fill. A fill is a man-made feature resulting from filling a low area, usually to form a level bed for a road or railroad track. Fills are shown on a map when they are at least 10 feet high, and they are drawn with a contour line along the fill line. This contour line extends the length of the filled area and has tick marks that point toward lower ground. If the map scale permits, the length of the fill tick marks are drawn to scale and extend from the base line of the fill symbol.
10-7. INTERPRETATION OF TERRAIN FEATURES
Terrain features do not normally stand alone. To better understand these when they are depicted on a map, you need to interpret them. Terrain features (Figure 21) are interpreted by using contour lines, the SOSES approach, ridgelining, or streamlining.
Figure 21. Terrain features.
- Contour Lines. Emphasizing the main contour lines is a technique used to interpret the terrain of an area. By studying these contour lines, you able to obtain a better understanding of the layout of the terrain and to decide on the best route.
- The following description pertains to Figure 22. Running east to west across the complex landmass is a ridgeline. A ridgeline is a line of high ground, usually with changes in elevation along its top and low ground on all sides. The changes in elevation are the three hilltops and two saddles along the ridgeline. From the top of each hill, there is lower ground in all directions. The saddles have lower ground in two directions and high ground in the opposite two directions. The contour lines of each saddle form half an hourglass shape. Because of the difference in size of the higher ground on the two opposite sides of a saddle, a full hourglass shape of a saddle may not be apparent.
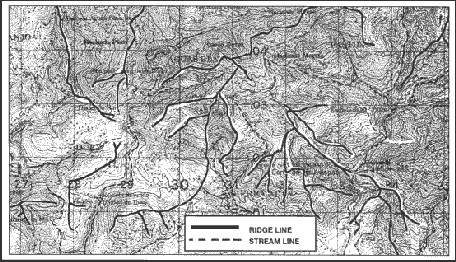
Figure 22. Ridgelining and streamlining.
- There are four prominent ridges. A ridge is on each end of the ridgeline and two ridges extend south from the ridgeline. All of the ridges have lower ground in three directions and higher ground in one direction. The closed ends of the U’s formed by the contour lines point away from higher ground.
- To the south lies a valley; the valley slopes downward from east to west. Note that the U of the contour line points to the east, indicating higher ground in that direction and lower ground to the west. Another look at the valley shows high ground to the north and south of the valley.
- Just east of the valley is a depression. There is higher ground in all directions when looking from the bottom of the depression.
- There are several spurs extending generally south from the ridgeline. They, like ridges, have lower ground in three directions and higher ground in one direction. Their contour line U’s point away from higher ground.
- Between the ridges and spurs are draws. They, like valleys, have higher ground in three directions and lower ground in one direction. Their contour line U’s and V’s point toward higher ground.
- Two contour lines on the north side of the center hill are touching or almost touching. They have ticks indicating a vertical or nearly vertical slope or a cliff.
- The road cutting through the eastern ridge depicts cuts and fills. The breaks in the contour lines indicate cuts, and the ticks pointing away from the roadbed on each side of the road indicate fills.
- SOSES. A recommended technique for identifying specific terrain features and then locating them on the map is to make use of five of their characteristics known by the mnemonic SOSES. Terrain features can be examined, described, and compared with each other and with corresponding map contour patterns in terms of their shapes, orientations, sizes, elevations, and slopes.
- Shape. The general form or outline of the feature at its base.
- Orientation. The general trend or direction of a feature from your viewpoint. A feature can be in line, across, or at an angle to your viewpoint.
- Size. The length or width of a feature horizontally across its base. For example, one terrain feature might be larger or smaller than another terrain feature.
- Elevation. The height of a terrain feature. This can be described either in absolute or relative terms as compared to the other features in the area. One landform may be higher, lower, deeper, or shallower than another.
- Slope. The type (uniform, convex, or concave) and the steepness or angle (steep or gentle) of the sides of a terrain feature.
Through practice, you can learn to identify several individual terrain features in the field and see how they vary in appearance.
- Ridgelining. This technique helps you to visualize the overall lay of the ground within the area of interest on the map. Follow these steps:
- Identify on the map the crests of the ridgelines in your area of operation by identifying the close-out contours that lie along the hilltop.
- Trace over the crests so each ridgeline stands out clearly as one identifiable line.
- Go back over each of the major ridgelines and trace over the prominent ridges and spurs that come out of the ridgelines.
The usual colors used for this tracing are red or brown; however, you may use any color at hand. When you have completed the ridgelining process, you will find that the high ground on the map will stand out and that you will be able to see the relationship between the various ridgelines Figure 22.
- Streamlining. This procedure (Figure 22) is similar to that of ridgelining.
- Identify all the mapped streams in the area of operations.
- Trace over them to make them stand out more prominently.
- Then identify other low ground, such as smaller valleys or draws that feed into the major streams, and trace over them.
PROFILES
This brings out the drainage
pattern and low ground on the map. The color used for this is usually blue; but
again, if blue is not available, use any color at hand so long as the
distinction between the ridgelines and the streamlines is clear.
The study of contour lines to determine high and low points of elevation is usually adequate. However, there may be a few times when we need a quick and precise reference to determine exact elevations of specific points. When exactness is demanded, a profile is required. A profile is an exaggerated side view of a portion of the earth’s surface along a line between two or more points.
- A profile can be used for many purposes. The primary purpose is to determine the easiest way to travel through the terrain.
- A profile can be constructed from any contoured map. Its construction requires the following steps:
- Draw a line on the map from where the profile is to begin to where it is to end (Figure 23).
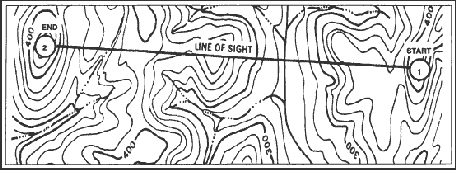
Figure 23. Connecting points.
- Find the value of the highest and lowest contour lines that cross or touch the profile line. Add one contour value above the highest and one below the lowest to take care of hills and valleys.
- Select a piece of lined notebook paper with as many lines as was determined in (2) above. Any paper with 1/4-inch lines is ideal. Wider lines, up to 5/8-inch, may be used. If lined paper is not available, draw equally spaced horizontal lines on a blank sheet of paper.
- Number the top line with the highest value and the bottom line with the lowest value as determined in (2) above.
- Number the rest of the lines in sequence, starting with the second line from the top. The lines will be numbered in accordance with the contour interval (Figure 24).
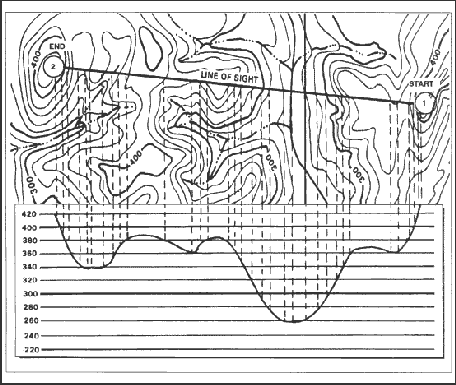
Figure 24. Dropping perpendiculars.
- Place the paper on the map with the lines next to and parallel to the profile line (Figure 24).
- From every point on the profile line where a contour line, stream, intermittent stream, or other body of water crosses or touches, drop a perpendicular line to the line having the same value. Place a tick mark where the perpendicular line crosses the number line (Figure 24) Where trees are present, add the height of the trees to the contour line and place a tick mark there. Assume the height of the trees to be 50 feet or 15 meters where dark green tint is shown on the map.
- After all perpendicular lines have been drawn and tick marks placed where the lines cross, connect all tick marks with a smooth, natural curve to form a horizontal view or profile of the terrain along the profile line (Figure 24).
| NOTE: | The profile drawn may be exaggerated. The spacing between the lines drawn on the sheet of paper determines the amount of exaggeration and may be varied to suit any purpose. |
- Draw a straight line from the start point to the end point on the profile. If the straight line intersects the curved profile, line of sight to the end point is not available (Figure 25)
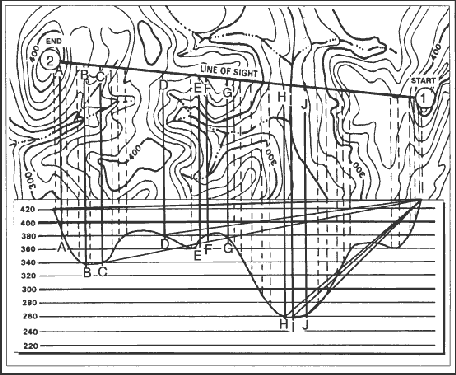
Figure 25. Drawing lines to additional points.
- Determine the line of sight to other points along the profile line by drawing a line from the start point to additional points. In Figure 26 line of sight is available to—
| A—Yes | D—Yes | G—Yes |
| B—No | E—No | H—No |
| C—No | F—No | I—No |

Figure 26. Drawing a hasty profile.
The vertical distance between navigable ground up to the line of sight line is the depth of defilade.
- When time is short, or when a complete profile is not needed, one may be constructed showing only the hilltops, ridges, and if desired, the valleys. This is called a hasty profile. It is constructed in the same manner as a full profile (Figure 26).
Mapping Level 3 Requirements:
- Be able to identify the types of slopes
- Be able to identify ills, valleys, saddles, ridges, depression, draw, spur, cliff, cut and fill
- Be able to take the contour lines and graphically represent the terrain
- Know the four methods of interpreting terrain features